Showing posts with label training. Show all posts

Mar 17, 2017

Patent Research > Reporting & Presentation - Mindmaps & Clustering Logic

In our first two training articles, we talked about assignee/applicant cleaning in patent research studies using Open Refine and presenting your patent landscape results and insights using tableau.

This article is on the same lines as the latter one, but it specifically focuses on an important part of reporting and presentation for patent and research landscape studies - mind maps.


What are mind maps?

Mind maps are a visual way of communicating the logic you used to cluster your patent (as well as research paper) results in your presentation.

Why are mind maps important?

When you cluster references (patents and research papers), your clustering logic should be crystal clear for you to actually get some insights out of your hard work.
Something like this - If a patent discloses x feature, tag it under the x column, if it discloses y feature, tag it under y column.
This logic needs to be uniform, for you to get meaningful insights out of your patent research, and it also needs to be presented with your results. This is where mind maps come handy.

There are many programs that let you prepare mind maps - both paid as well as open source (read free). MindManager from Mindjet and XMind are two well-known examples of mind mapping tools that you can use to create mind maps for your patent landscape studies.


What's new?

Apart from these two, you should also try out these super awesome collaborative online mind mapping tools. Their benefit is that they are online, you do not need to install a program.

Many of them come with a free trial or a basic version that you can use, and some of them also offer an option wherein multiple team members can collaborate on creating a mind map. Check them out!


Freemind (free and effective!)


bubbl.us (super cute!)

Mar 11, 2017

Patent Research Training > Data Cleaning > Assignee (Player / Company Name) Cleaning & Normalization

Meaningful data visualisation and insight generation requires clean data. What we mean by clean data is normalised or sanitised data - data that follows a certain rule to be uniform, so as to be comparable. Only uniform things are comparable and normalisation or sanitization of data is an important part of patent research because of the inherent inconsistencies of some data points.

One of the major data points of patents that need this 'cleaning' (in other words normalisation) is company (or institutes, universities, labs, etc.) names. These are called assignee/applicant names in patentese (patent language).


Assignee/applicant cleaning has many methods in terms of choosing the right assignee name - that is not something we will be discussing in this post. We will focus on learning how to use one open source tool (a very powerful one) for assignee cleaning - Open Refine (formerly known as Google Refine).

So in essence, this article will help you get started with using open refine for cleaning data in the assignee/applicant column with company/university names but not really delve into which name to choose and other aspects (I may cover them in a separate article later).

Steps:
  1. Install Open Refine on your PC (It's open source, and hence its free for use) - >>
  2. Get patent data and try the Open Refine software for assignee cleaning - >>

Patent Research Training > Data Cleaning > Assignee (Player / Company Name) Cleaning & Normalization - II

Open Refine is a really powerful tool for dealing with data, especially for normalizing data and cleaning it.

Following steps can be followed to install Open Refine and get it running on your system:

1. Go to http://openrefine.org/download.html

2. Find the latest download option for windows (or mac - though this article will focus on Windows). Right now, this is 'OpenRefine 2.7-rc2 Release Candidate 2'


You just have to download the zip file and unzip it.


Once unzipped into a folder of your choice, click on the icon with a diamond (too easy to recognize :))


You will get a black screen (command prompt) and it will open a browser tab


Voila! you have successfully installed and started the Open Refine software, and now you can upload your files.
Notice the address of this tab - it is not a web address, but rather your own computer - so it's essentially OK to upload any files from your computer on this address, because the files wouldn't be uploaded on any website. You can still use your discretion, though.


Patent Research Training > Data Cleaning > Assignee (Player / Company Name) Cleaning & Normalization - III


1. Create Project

Once you have your data excel sheet ready, you can go to the starting page of Open Refine and upload it. You should see something like this after you upload your sheet:


I used an excel result from espacenet; however, any format will be good for this.

For now, do not vary any options, just click on Create Project.

2. Selection of Text Facets

Once you create the project, you should see a screen like the one shown below where you can select the options I have highlighted


3. Cluster - Text Facets

Once you select the highlighted options, you should see something like this:


4. Merging the cluster suggestions

Open Refine gives multiple options to find similar looking text entries that can be normalized. All of these are essentially algorithms (but you don't need to look them up in detail, unless you want to)

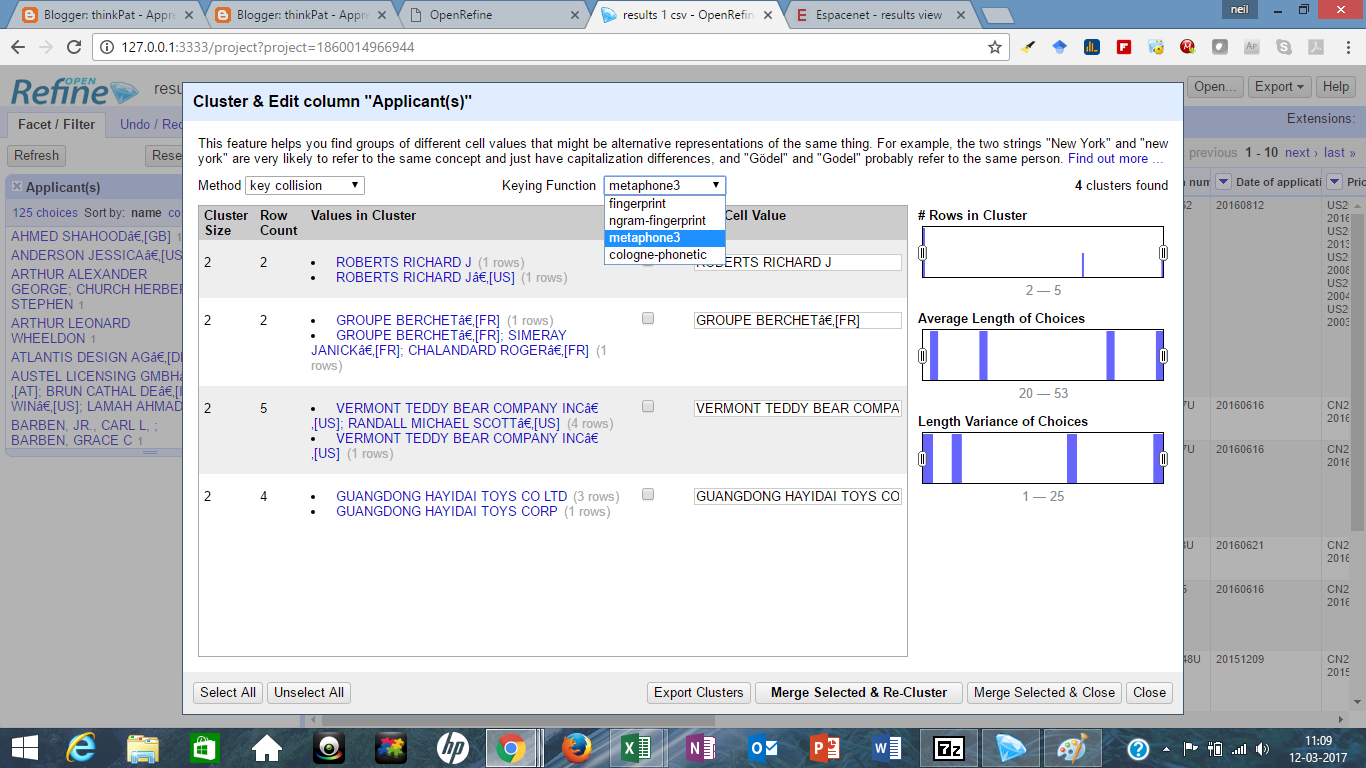
The first option will be Method - 'key collision' based on Keying Function - 'fingerprint'


See the first cluster values: These are two variations of writing the same company name. We have successfully identified this anomaly - now select the Merge? option and click on 'Merge Selected & Re-Cluster' button at the bottom.

Once you don't see any options after re-clustering, simply select another Keying function at the top:


See the first and the fourth cluster suggestions using the 'metaphone3' keying function.

Once you have tried other keying functions in the 'key collision' method, try the other method instead of 'key collision' as well - which is 'nearest neighbor'


Again, we find similar looking names that might be typo errors. (we get a lot of these in patent data now, don't we?)

After checking all methods and merging the ones you think are correct, you can click on close and then export the sheet for further use.


The exported excel (or CSV, if you like) will have the Applicant(s) column modified according to the changes you have made using the Merge Selected option.

Give this a try and let me know in the comments if you face any issues.

Overall, keep exploring Open Refine, and discover its other functions. There are lots of them!

Mar 5, 2017

Patent Research - Training - Beginner to Intermediate - Data Visualization Using Tableau

Visualization is one of the most important aspects of patent research, or for that matter any market research project.

However, most of the market and patent research reports based on landscaping and market overview usually consist of visualizations based on excel and PowerPoint including graphs and charts. Although these visualizations serve the purpose, the idea of this training article is to offer a perspective into making these graphs and charts look professional and beautiful.


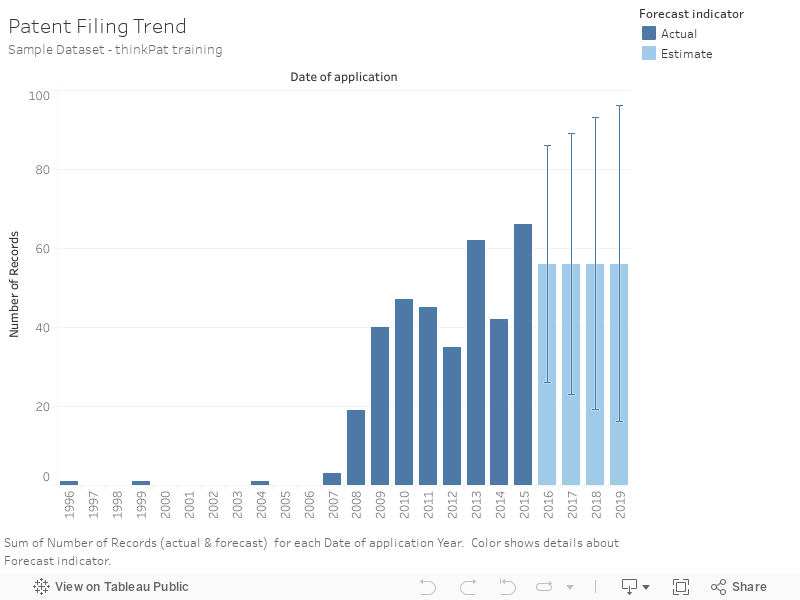
In this training article, we will be looking at using Tableau to make basic patent research graphs and charts as an example for beginner and intermediate patent research professionals to try this free feature out for their practice.

Not only is Tableau public available for free for you to try, it also adds up as an additional skill for you to have in terms of data visualization. Plus, the graphs and charts are very good looking and beautiful and it is super fun!

Next: Setting up Tableau Public for Patent Research Visualization>>


Patent Research - Training - Beginner to Intermediate - Data Visualization Using Tableau - Part II

Tableau is a powerful software, much user friendly in terms of creating stunning graphs and charts than excel for sure. Its just that excel wasn't built keeping graphing and charting in mind - it is a powerful spreadsheet software, while Tableau is specifically built for this.

First step is getting started with Tableau public:
Keep this in mind - Tableau public, while free, by definition is public - anything you post is freely accessible to everyone. Please make sure you do not post anything that you shouldn't post publicly!


Step 1 - Creating a profile on Tableau

This is super easy

  1. Go to https://public.tableau.com/s/
  2. Click the Sign in button on top
  3. A pop up window will appear - look at its bottom where you will find something like "Create one now for free"
  4. Then fill the form and click create profile


Step 2 - Go to https://public.tableau.com/s/

Enter your email address in the box and click download the app to download tableau public application on your PC.


Next - Starting Tableau and preparing patent data >>

Patent Research - Training - Beginner to Intermediate - Data Visualization Using Tableau - Part III

Step 3 - Prepare your data

Just for illustrative purposes, I downloaded a results CSV by searching for electric guitars on espacenet, You can use your own data, but just so that you can easily follow this article, download using espacenet so the CSV will have the same columns.

Step 4 - Open Tableau Public on your computer and open the patent results CSV in tableau

Click on Text file and open CSV located in your computer


It should look like this when open


Click on the option I have highlighted with a black colored circle

Now watch this GIF to see how you can play around with the data


Once, you are done playing around with the format and the data points, there are other final steps:


Patent Research - Training - Beginner to Intermediate - Data Visualization Using Tableau - Part IV

Finalization

Make changes to your graph and charts using the options highlighted below

Rename Sheet 2 by double clicking and writing your own chart title

Editing options such as color, size, label etc in marks


Don't forget the captions:


After this, you can just take a screen shot of your graph and use it in your PowerPoint.

If you click on save on top, you will need to login to your Tableau profile and it will be saved on your profile - this will be publicly available to everyone (so don't do it with sensitive data)

There are many options in Tableau public, and I would encourage you to try them out yourself.

For example, I have uploaded two simple graphs on my public profile - check them out.

Feb 11, 2017

Company Assessment / Due Diligence - For Acquisition (M&A) using Patent metrics (IP / Patent Portfolio Strength)

Patent metrics such as citations, grant lag, market size (jurisdictions / regions / countries marked as priority extensions), number of broad IPC classes, and number of claims and their word count as well as their complexity are all well known factors and parameters used to judge the strength (legal, commercial and to an extent technical) of the patent or a group of patents (portfolio).

One factor that gives an indication of the overall technological backbone of a company in most technological areas is the strength of the patents it has in the product range it focuses on.

This indication or assessment of the stability of the technological dependability might be of interest to a company or group looking to acquire the company.

One way of looking at understanding this stability (the sustainability of the innovativeness of the company) is to understand if the lead inventors of its key patents or core patents of its focused product range (or a product range that has the maximum profitability / market share) are still working in the company.

Going a step further, it is also interesting to know two other related aspects:
  1. If the lead inventors are still with the company, how has their role grown (with respect to the time they spent)
  2. If the lead inventors have left the company, where have they gone? what is the current focus?
    1. Have they branched off with their own company?
      1. Is this branch off in anyway connected to the company under due diligence?
    2. Have they moved to a competitor?
This information can be transformed into an index for getting a quantitative measure or can be kept qualitative to form key takeaway guidelines on the company's talent retention strategy as well as the overall competitive forces acting on the company and its focused product range / application area.