Showing posts with label data visualization. Show all posts

Mar 17, 2017

Patent Research > Reporting & Presentation - Mindmaps & Clustering Logic

In our first two training articles, we talked about assignee/applicant cleaning in patent research studies using Open Refine and presenting your patent landscape results and insights using tableau.

This article is on the same lines as the latter one, but it specifically focuses on an important part of reporting and presentation for patent and research landscape studies - mind maps.


What are mind maps?

Mind maps are a visual way of communicating the logic you used to cluster your patent (as well as research paper) results in your presentation.

Why are mind maps important?

When you cluster references (patents and research papers), your clustering logic should be crystal clear for you to actually get some insights out of your hard work.
Something like this - If a patent discloses x feature, tag it under the x column, if it discloses y feature, tag it under y column.
This logic needs to be uniform, for you to get meaningful insights out of your patent research, and it also needs to be presented with your results. This is where mind maps come handy.

There are many programs that let you prepare mind maps - both paid as well as open source (read free). MindManager from Mindjet and XMind are two well-known examples of mind mapping tools that you can use to create mind maps for your patent landscape studies.


What's new?

Apart from these two, you should also try out these super awesome collaborative online mind mapping tools. Their benefit is that they are online, you do not need to install a program.

Many of them come with a free trial or a basic version that you can use, and some of them also offer an option wherein multiple team members can collaborate on creating a mind map. Check them out!




Freemind (free and effective!)


bubbl.us (super cute!)

Mar 5, 2017

Patent Research - Training - Beginner to Intermediate - Data Visualization Using Tableau

Visualization is one of the most important aspects of patent research, or for that matter any market research project.

However, most of the market and patent research reports based on landscaping and market overview usually consist of visualizations based on excel and PowerPoint including graphs and charts. Although these visualizations serve the purpose, the idea of this training article is to offer a perspective into making these graphs and charts look professional and beautiful.


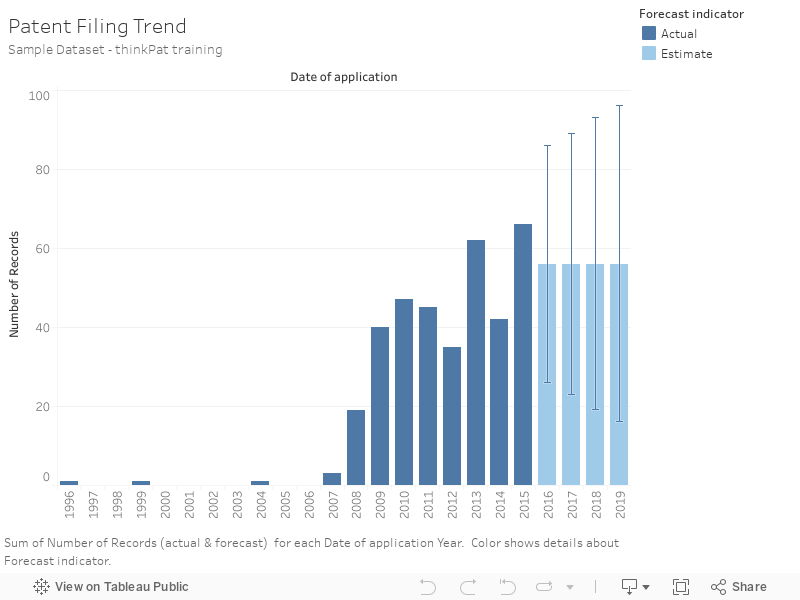
In this training article, we will be looking at using Tableau to make basic patent research graphs and charts as an example for beginner and intermediate patent research professionals to try this free feature out for their practice.

Not only is Tableau public available for free for you to try, it also adds up as an additional skill for you to have in terms of data visualization. Plus, the graphs and charts are very good looking and beautiful and it is super fun!

Next: Setting up Tableau Public for Patent Research Visualization>>


Patent Research - Training - Beginner to Intermediate - Data Visualization Using Tableau - Part II

Tableau is a powerful software, much user friendly in terms of creating stunning graphs and charts than excel for sure. Its just that excel wasn't built keeping graphing and charting in mind - it is a powerful spreadsheet software, while Tableau is specifically built for this.

First step is getting started with Tableau public:
Keep this in mind - Tableau public, while free, by definition is public - anything you post is freely accessible to everyone. Please make sure you do not post anything that you shouldn't post publicly!


Step 1 - Creating a profile on Tableau

This is super easy

  1. Go to https://public.tableau.com/s/
  2. Click the Sign in button on top
  3. A pop up window will appear - look at its bottom where you will find something like "Create one now for free"
  4. Then fill the form and click create profile


Step 2 - Go to https://public.tableau.com/s/

Enter your email address in the box and click download the app to download tableau public application on your PC.


Next - Starting Tableau and preparing patent data >>

Patent Research - Training - Beginner to Intermediate - Data Visualization Using Tableau - Part III

Step 3 - Prepare your data

Just for illustrative purposes, I downloaded a results CSV by searching for electric guitars on espacenet, You can use your own data, but just so that you can easily follow this article, download using espacenet so the CSV will have the same columns.

Step 4 - Open Tableau Public on your computer and open the patent results CSV in tableau

Click on Text file and open CSV located in your computer


It should look like this when open


Click on the option I have highlighted with a black colored circle

Now watch this GIF to see how you can play around with the data


Once, you are done playing around with the format and the data points, there are other final steps:


Patent Research - Training - Beginner to Intermediate - Data Visualization Using Tableau - Part IV

Finalization

Make changes to your graph and charts using the options highlighted below

Rename Sheet 2 by double clicking and writing your own chart title

Editing options such as color, size, label etc in marks


Don't forget the captions:


After this, you can just take a screen shot of your graph and use it in your PowerPoint.

If you click on save on top, you will need to login to your Tableau profile and it will be saved on your profile - this will be publicly available to everyone (so don't do it with sensitive data)

There are many options in Tableau public, and I would encourage you to try them out yourself.

For example, I have uploaded two simple graphs on my public profile - check them out.